What is Stoxly?
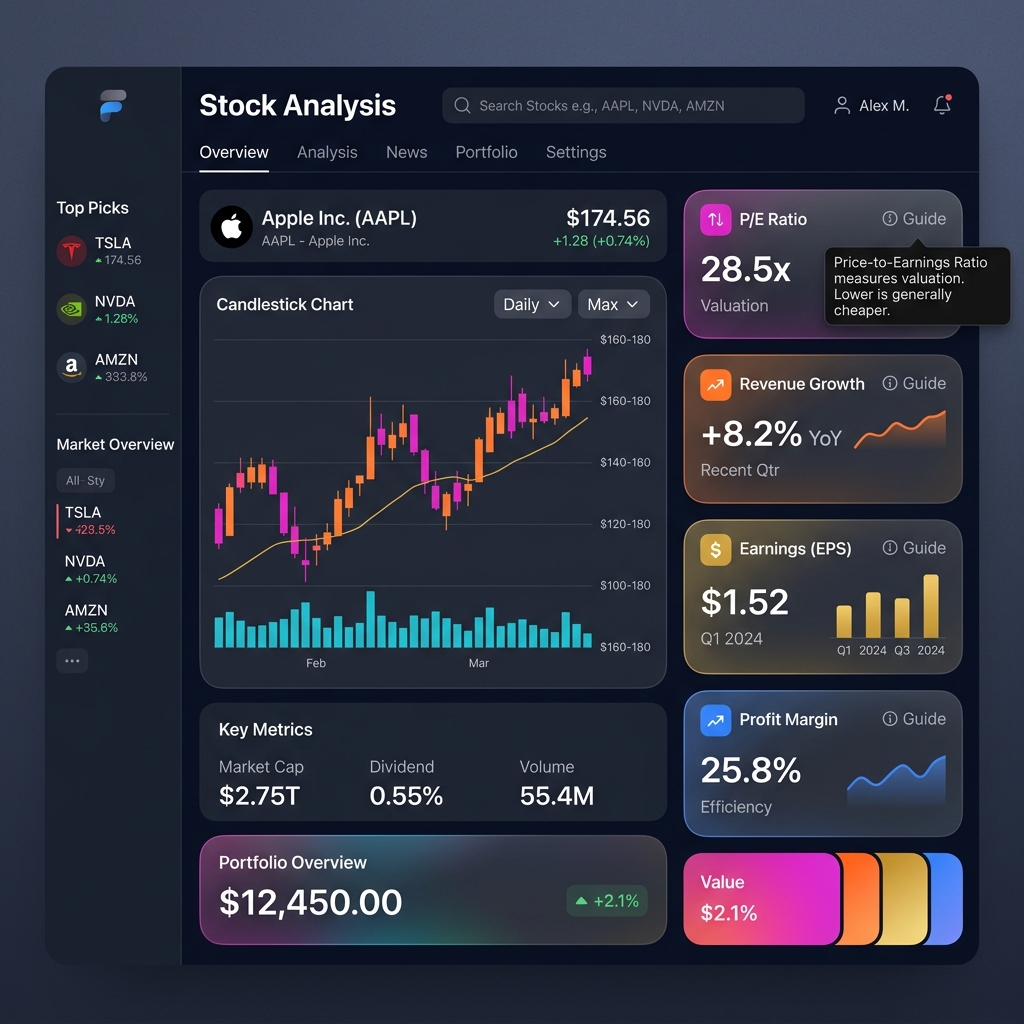
Stoxly is an all-in-one financial platform built on three core pillars: Stock Analysis
(featuring both Beginner and Expert modes), comprehensive Portfolio Tracking, and a
suite of interactive Financial Tools (like FIRE and DCF calculators). We provide the
metrics that matter so you can make smarter investment decisions.
Is Stoxly suitable for beginners?
Absolutely. Stoxly's Beginner Mode transforms complex financial data into clear, guided visuals with
helpful tooltips that explain what each metric means and why it matters. You'll learn as you analyze,
making it perfect for first-time investors.
What kind of data and analysis does Stoxly offer?
We provide comprehensive fundamental data including P/E ratios, revenue growth, profit margins, free cash
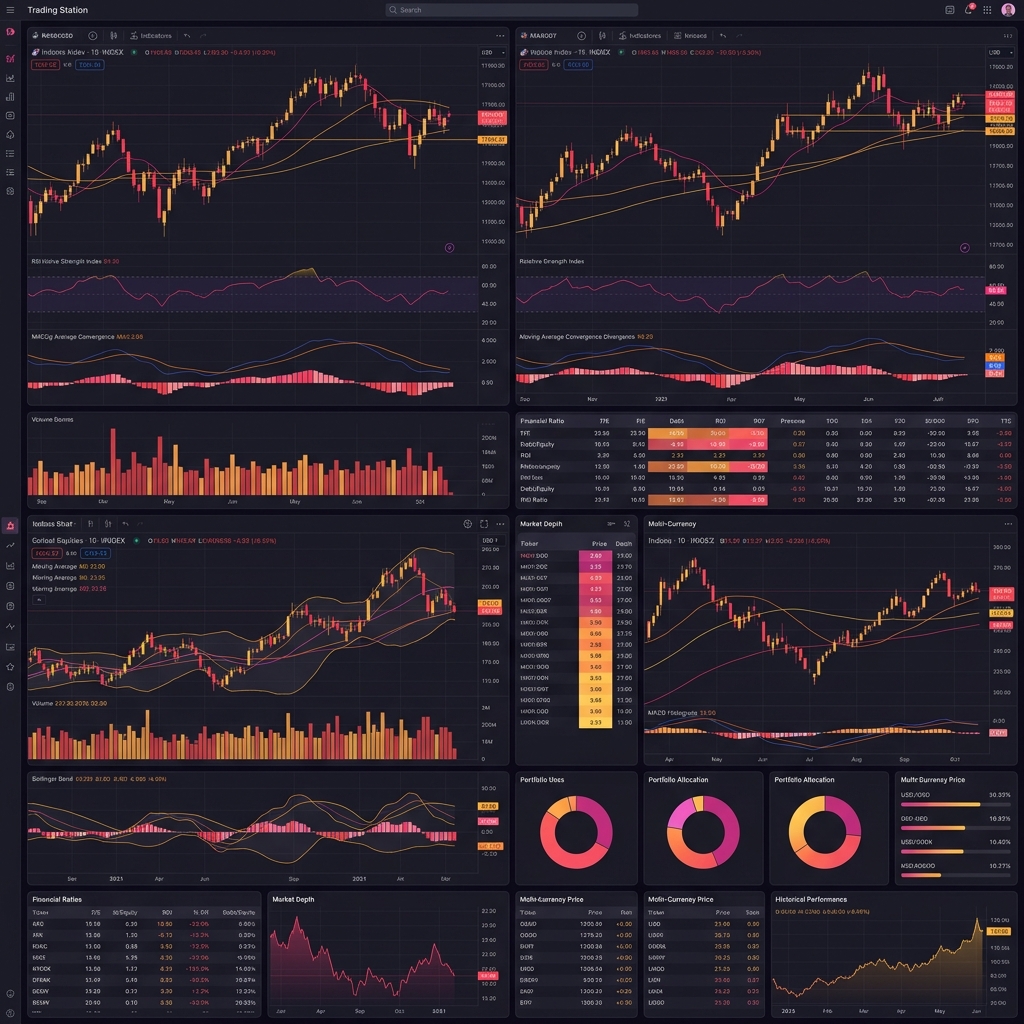
flow, and dividend yields. For seasoned investors, our Expert Mode adds technical indicators,
candlestick charting, moving averages, and multi-stock comparison tools.
Is Stoxly's portfolio tracker free to use?
Yes! You can create and manage your investment portfolio for free on Stoxly—up to 10 holdings. Free users
can add stocks, view insights, and receive updates. Paid plans allow you to track more holdings, create
multiple portfolios, and unlock advanced features.
How can I create a portfolio on Stoxly?
There are three easy ways to get started:
- Link your broker: Securely connect your brokerage account, including
Robinhood, Fidelity, Charles Schwab, DEGIRO, and over 1,000 other supported brokers, to
automatically import your holdings. Your portfolio refreshes daily with the latest data.
- Add your holdings manually: Quickly enter stocks, number of shares,
and average cost for basic tracking of unrealised gains.
- Import your full transaction history: Upload with our AI import or
paste your buy and sell transactions for detailed performance tracking, including realised and
unrealised gains, dividends, currency impact, and annualised return (IRR).
What are the benefits of using Stoxly's portfolio tracker?
Stoxly goes far beyond price tracking. You'll be able to:
- Receive relevant updates on your companies, including earnings,
analyst forecasts, insider activity, and risks.
- Assign a narrative from our analysts or the community to understand
the story behind each stock.
- Set and track your own valuation for each holding.
- Measure diversification by sector and geographic revenue exposure.
- Benchmark your portfolio against the market using key financial
metrics.
- Track detailed returns over any time frame. With transactions added,
you get a breakdown of realised gains, unrealised gains, dividends, currency effects, and your
annualised return (IRR).
Can I track dividends in my portfolio?
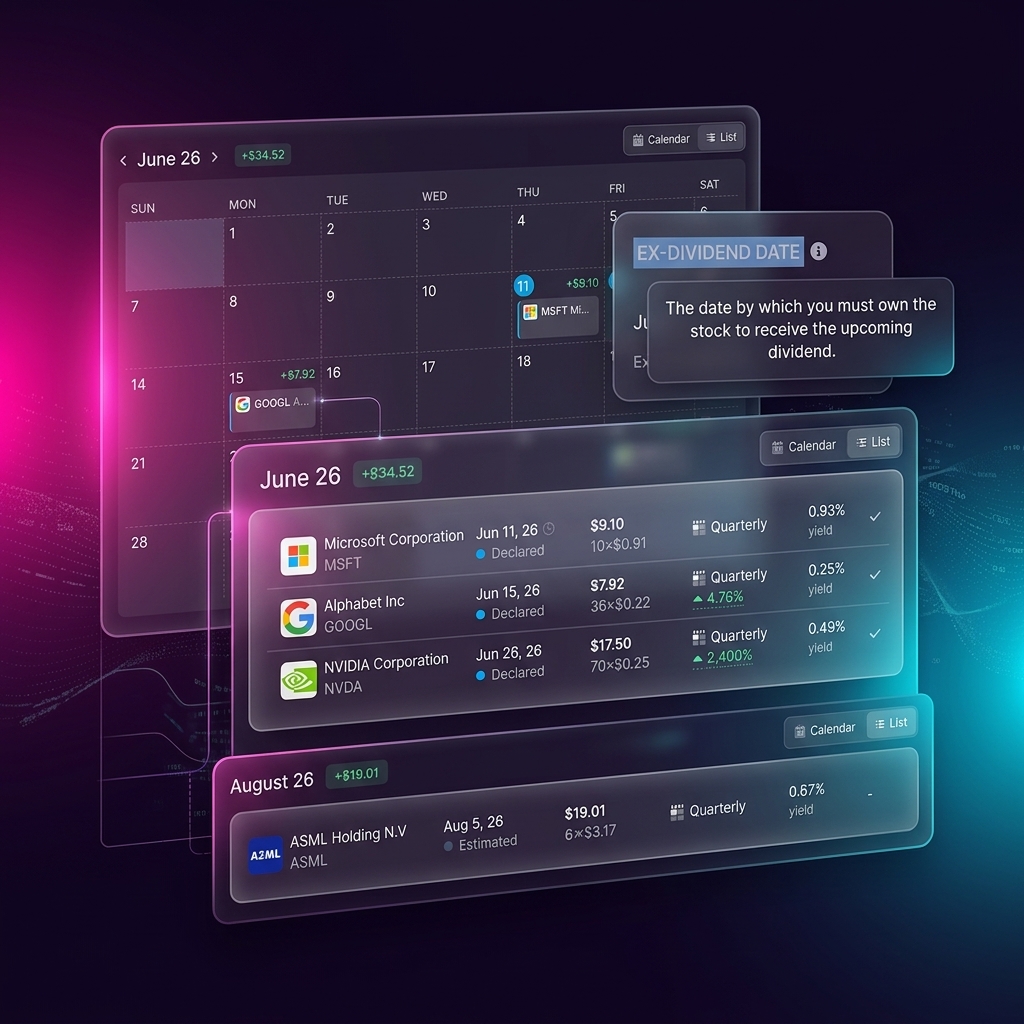
Yes. We track both historical dividends you've received and forecasted income from your current holdings.
We also assess dividend quality, so you can avoid unreliable payers and protect your future income
stream.
What free Financial Tools and Calculators are included?
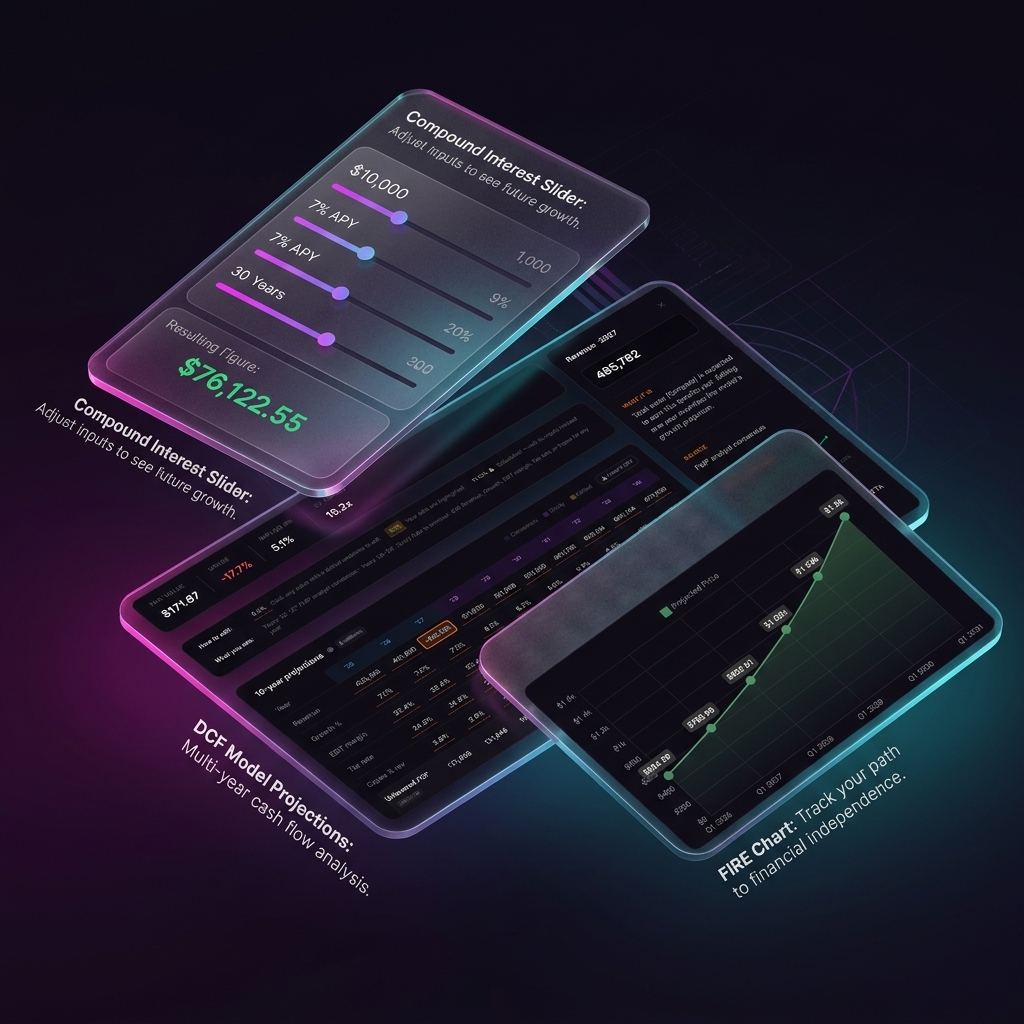
Our completely free Financial Tools suite includes a Compound Interest Calculator to
project your long-term wealth, a Dividend Forecaster to estimate your passive income, a
FIRE Calculator to plan your early retirement, and a highly customizable Discounted
Cash Flow (DCF) Valuation Tool to find the intrinsic value of any stock.
How often is data updated?
Financial data is updated daily during market hours. Our free calculators run entirely client-side, so
they're always available and update instantly as you adjust inputs. Real-time data feeds are available
on Pro and Premium plans.
Do I need a credit card to get started?
No! Our Stoxly Starter plan is completely free and requires no credit card. You can explore stock
analysis, use our financial calculators, and track a portfolio without any payment information.
Is there a refund policy?
Yes. We offer a 14-day money-back guarantee on all paid plans. If Stoxly doesn't meet your expectations,
contact our support team within 14 days of purchase for a full refund, no questions asked.
Can I cancel anytime?
Yes, you can cancel your subscription at any time from your account settings. Your access will continue
until the end of your current billing period. There are no cancellation fees or long-term
commitments.